
Lighthouse 100, Still No Sales: What Devs Miss

A client's newsletter system ran every issue off one shared template. Edit one, change them all.
That's global mutable state, shipped to production as a content system.
Disclosure... I run a small studio, Everther Studio, and the client projects below are ours. The pattern shows up well beyond Kajabi, so here's where a clean build still leaks revenue, with numbers.
The shared-template problem
The client, a UK choir mentorship platform, had built their first paywalled newsletter in Kajabi's default newsletter area. Every design change overrode every issue. Issue 4 couldn't look different from Issue 3 without touching Issue 3.
We rebuilt it across three Kajabi systems. A landing page per issue, each with its own unguessable URL and SEO disabled. A course product as the members-only archive. A membership offer handling £12/month billing with two free issues. Drip runs off enrolment date, so every subscriber gets Issue 1 on day 0, Issue 2 on day 30, Issue 3 on day 60, whenever they joined.
Each issue became an independent unit, which it should have been from the start. Shared state works until the first time 2 things need to differ.
Lab scores don't pay anyone
Lighthouse runs on your machine, your network, your warm cache. Your customers are on a mid-range phone and mobile data. Google's "good" thresholds are LCP under 2.5s, INP under 200ms and CLS under 0.1, and the number that matters is the one real users hit.
Renault did this properly. They used the web-vitals library to send real-user metrics into Google Analytics, then analysed 10 million landing page visits. A one-second LCP improvement tracked with 13% more conversions and a 14-point lower bounce rate. Rakuten 24 went further with an A/B test: same visuals, same functionality, Core Web Vitals work only. Conversion rate rose 33.13% and revenue per visitor 53.37%.
Both are large retailers, so don't copy the numbers. Copy the method-
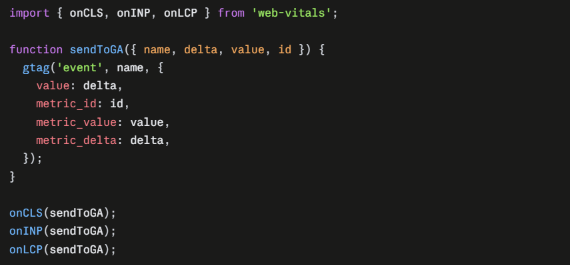
Then segment by page template and device. Say a product page sits at a 4s LCP and a blog post at 1.2s. Those need different fixes, and a single site-wide score hides it.
Instrument the funnel, not the page
A page score can't tell you where people leave. GA4's recommended ecommerce events can: view_item, add_to_cart, begin_checkout, add_payment_info, purchase. Fire all five and you get drop-off at every step.
That's the unglamorous part of a Shopify store we worked on. Shopping ads were blocked by a Merchant Center suspension, and the campaigns still running returned 1.87 ROAS against a 4X goal. My role was ads, not frontend. We fixed the feeds, set up GA4 with custom conversions, and restructured the campaigns. 2 months later: 4.5X ROAS, over $20,000 a month.
The work wasn't frontend work. Measurement is what moved it.
Forms are code too
Baymard's data puts average cart abandonment at 70.22% across 50 studies, with 42% of US shoppers citing "just browsing". The remainder is where devs have real influence. Their testing says an ideal checkout can be as short as 12 to 14 form elements. Strict password rules caused up to 19% abandonment among returning users who struggled to sign in. They estimate the average large ecommerce site could gain 35.26% in conversion from checkout design. Large sites again, so treat it as direction.
What you control:
1- Correct autocomplete tokens (email, postal-code, cc-number) so browsers can fill fields
2- Matching type and inputmode so the mobile keyboard fits the field
3- Guest checkout as the visible default, not a hidden link
4- Password rules that don't punish returning users
5- Validation that explains the error next to the field
Put a number on it
Illustrative inputs: 3,000 visits a month, £70 average order. At 1% conversion that's £2,100 a month, at 2% it's £4,200. The gap is £25,200 a year, just over five times a £5,000 build. Use your own inputs.
Passing Lighthouse is the minimum. The build is done when you can say which step loses people and what that step costs.
----
If you've hit this, leave a comment. Curious what your setup looks like.